Evaluation and Comparison of Slow-Release Nitrogen (N) Sources
Research Topic: Evaluation and Comparison of Slow-Release Nitrogen (N) Sources on Tifway Bermudagrass (2009), Sartain, J.B., University of Florida
Abstract
Slow release nitrogen (SRN/WIN) fertilizers provide controlled nitrogen (N) release over a longer time period, increased N uptake efficiency, and the potential to limit nitrate (NO3-) leaching losses. Turfgrasses respond differently to N sources depending on the N release rate and their ability to sustain plant available N over time. A field study was initiated using Tifway bermudagrass maintained as a golf course fairway. The objectives of this trial were 1.) Determine the influence of various N sources on the visual quality response of Tifway bermudagrass and 2.) Determine the influence of various N sources on the growth rate and N uptake of Tifway bermudagrass. Treatments were applied once on 4-June with 4 replications. The 4 N sources were applied at a 1 lb N/M rate. Treatments included a 20-2-5 (methylene urea – 35% SRN), Green Spec® 16-4-8 (food protein and meal – 19% SRN), a 38-0-0 (SCU – 100% SRN) and a 15-5-15 (blended inorganic and poly/sulfur coated N – 6.5% SRN). Visual quality generally increased for the first 28 days among all treatments, with the Green Spec 16-4-8 providing the highest turf quality on day 21 (Figure 1). During the latter half of the trial (starting 28 DAT), the 20-2-5 (35%- SRN) provided the best bermudagrass quality, however none of the treatments were significantly different (Figure 1). 63 DAT, the visual quality for all of the N sources had declined to the minimum acceptable level (Figure 1). Only the Green Spec 16-4-8 (19% SRN) fertilizer produced significantly more shoot growth than the untreated control throughout the course of the experiment. 30 DAT the Green Spec 16-4-8 (19% SRN) fertilizer produce significantly more bermudagrass shoot growth than the 20-2-5 (MU – 35% SRN) and 38-0-0 (SCU – 100% SRN), respectively (Figure 2). Over the duration of the entire experiment, all fertilizer treatments allowed for more total N recovery by Tifway bermudagrass compared to the control (Figure 3). In addition, significantly more N was recovered from turf treated with the Green Spec 16-4-8 (19% SRN) compared to the 20-2-5 (35%-CRN) and untreated control (Figure 3). Expectedly, the fertilizers containing a higher percentage (%) of quickly available N (16-4-8 and 15-5-15, 81% and 96% respectively) provided the fastest improved turf quality response and promoted more shoot growth. A greater amount of N was also, as expected, recovered 30 DAT from turf treated with these fertilizers. Conversely, the fertilizers with a higher percentage (%) of SRN were slower to impact turf quality and the 20-2-5 (35% SRN) trended towards providing better turf quality during the latter half of the experiment (28-56 DAT). The SCU did not perform as well, in general, as the other formulations likely because SCU is old technology and N release more a function of soil water. Surprisingly, Tifway bermudagrass treated with the Green Spec 16-4-8 (19% CRN), a formulation containing a rather low percentage (%) of SRN, provided essentially similar quality 28-56 DAT as those formulations containing a much higher percentage of SRN (20-2-5 and 38-0-0, 35% and 100% respectively). While the MU formulation contains more SRN (35% v. 19%), microbes may convert the protein N source into available N more consistently, and/or with fewer environmental losses. This hypothesis is strengthened based on the N recovery data. The sand rootzone may have limited microbial activity and subsequently limited their conversion of the additional SRN (MU) applied. The Green Spec 16-4-8 formulation provided excellent versatility as a ‘hybrid’ fertilizer source, initiating a quick visual response and acceptable turf quality which was documented 56 DAT. Most importantly, more N was recovered from turf treated with the 16-4-8 (19% SRN) during the course of the entire study, indicating consistent availability and efficient use of N by Tifway bermudagrass maintained on a sand-based fairway.
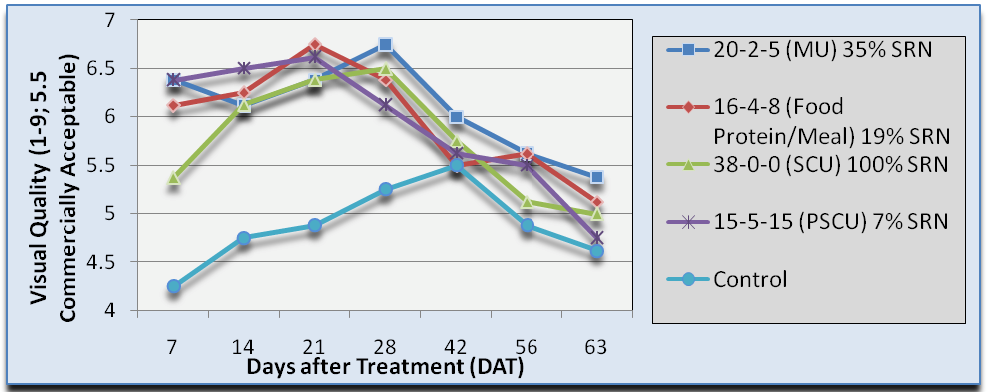
Figure 1. Effect of Nitrogen (N) source on Tifway Bermudagrass Mean Visual Quality
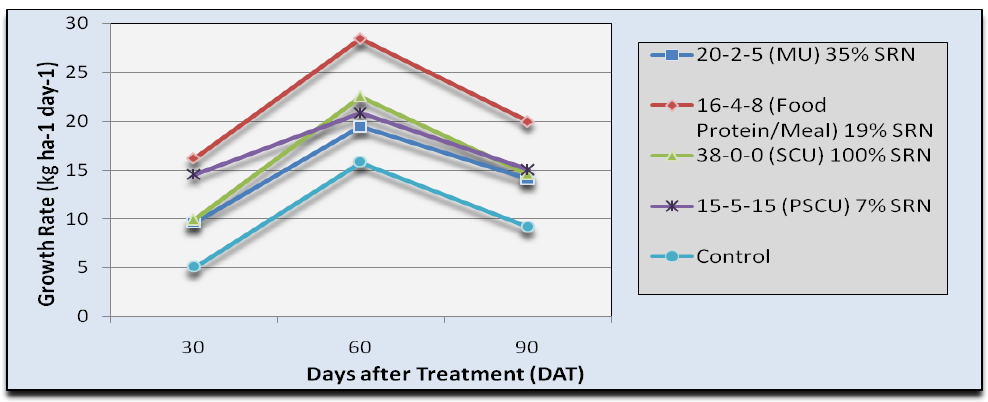
Figure 2. Effect of Nitrogen (N) source on Tifway Bermudagrass Mean Visual Quality
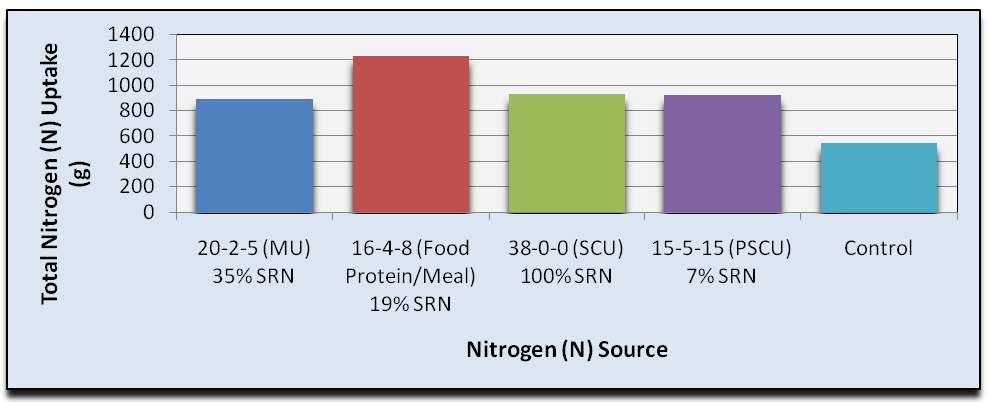
Figure 3.