Ultradwarf Bermudagrass Performance on Greensmix Differing in Water Holding Capacity
Ultradwarf Bermudagrass Performance on Greensmix Differing in Water Holding Capacity: The First Six Months Jim Camberato and Bruce Martin – Clemson University
Introduction
Ultradwarf bermudagrasses have become popular in the Carolinas as an alternative to TifDwarf bermudagrass and bentgrass. In many cases, the new bermudagrass varieties have been planted to newly constructed greens or renovated greens that have very low peat and high sand contents. These high infiltration rate and low water and nutrient holding capacity mixes are typically used for growing bentgrass. Leaching of nutrients and low moisture holding capacity may be the reason it is difficult to establish and maintain bermudagrass on these greens. This may be of more concern with the ultradwarfs especially considering their smaller root mass, in comparison to that of TifDwarf. Using soil to provide clay and organic matter increases the water and nutrient holding capacity of the mix and some of the most successful ultradwarf greens in the Carolinas were constructed with native soil as a component of the mix.
Given the difficulties encountered with ultradwarf bermudas on coarse sands with low moisture holding capacity our objective was to examine the influence of greensmix composition on several aspects of ultradwarf bermudagrass culture. This project was just initiated this past summer so we are reporting on the first six months of establishment.
Building the Green
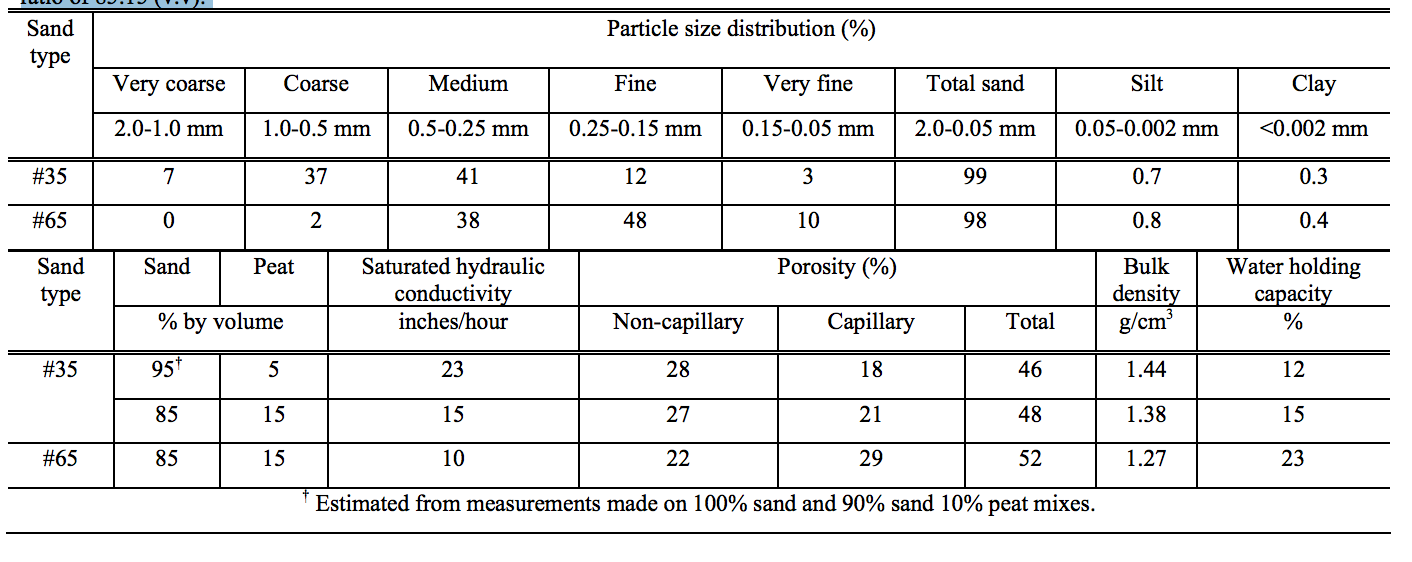
A 14,400 sq. ft. (240 by 60 ft.) green was established at the Pee Dee Research and Education Center, near Florence, SC in the summer of 2003. Each 80 by 60 ft. portion of the green is composed of a different sand and peat based mix. Mixes were:
1) a #35 sand in a sand to peat ratio of 95:5 (volume:volume),
2) a #35 sand in a sand to peat ratio of 85:15 (v:v), and
3) a #65 sand in a sand to peat ratio of 85:15 (v:v).
Characteristics of the mixes are listed in Table 1. Water holding capacity on a volume basis ranged from 12% for the #35 sand in a 95:5 ratio to 23% for the #65 sand. Each mix was underlain by 5 inches of gravel on top of the subgrade. Drainage was via flat tile drain on a 20 ft. spacing on a 45 degree angle from the green center to each side of the green.
MiniVerde was sprigged on 7/16/03 at 29 bushels/1000 sq. ft. and TifEagle was sprigged on 7/17/03 at 37 bushels/1000 sq. ft. Dolomitic limestone (21 lb/1000 sq. ft.), 34-0-0 (3.5 lb/1000 sq. ft.), 0-46-0 (5.2 lb/1000 sq. ft.), and 0-0-20 (5.6 lb/1000 sq. ft.) were applied to the newly sprigged green on 7/18. Additional fertilizer was applied on 7/23 (34-0-0 at 1.7 lb/1000 sq. ft. and 0-0-20 at 2.8 lb/1000 sq. ft.) and on 7/28 (16-4-8 at 1.6 lb/1000 sq. ft.). Beginning August 1, 2003 a standard fertilizer regiment, about 10 pounds of 10-10-10 per 1000 square feet, was applied weekly. Irrigation water was applied uniformly to all mixes, every other hour at 0.1 inches for one week and then twice daily thereafter.
Grow-In Experimental Treatments
Several experimental treatments were applied during grow-in to evaluate their impact on establishment and quality of the turf. In addition to the standard fertilizer application treatments applied August 14, August 20, September 3, and September17 were:
1) standard only
2) standard + NuBlade 2.5-5-2.5 at 12 fl.oz./1000 sq. ft. (8/14) and 3 fl.oz./1000 sq. ft. (8/20 & 9/3)
3) standard + Gary’s Green 18-3-4 plus iron and UltraPlex 5-0-3 at 4 and 1 fl.oz./1000 sq. ft.
4) standard + RyzUp 4% gibberellic acid at 0.5 fl.oz./1000 sq. ft.
5) standard + ZeoPro 0.1-0.1-0.6 at 15 lb/1000 sq. ft.
6) standard + Gypsum 20% calcium at 12 lb/1000 sq. ft.
There were four replications of each treatment on each soil mix/variety combination and plot size was 6' by 15'. Turf quality was assessed on a scale of 1-9 with 1=bare ground and 9=perfect turf. The percentage of ground cover was also visually assessed.
Results
Grow-in was dramatically slower on the #35 sand 95:5 mix than the other two mixes (Photo 1). At 5 weeks after sprigging ground coverage was less than 70% on the #35 sand 95:5 mix, whereas it was about 80% on the #35 sand 85:15 mix and 85% on the #65 sand (Figure 1). MiniVerde had more coverage than TifEagle on the #35 sand 95:5 mix , 65 vs 48%, but the varieties did not differ on the mixes with higher water holding capacity. Six weeks after sprigging, both varieties achieved nearly 100% ground cover on the #35 sand 85:15 and #65 sand 85:15 mix, but only 76% and 89% coverage was achieved on the #35 sand 95:5 mix for TifEagle and MiniVerde, respectively (Figure 1). Grow-in was not complete even after 10 weeks on the #35 sand 95:5 mix (Figure 1).
RyzUp (treatment #4) tended to increase establishment on the #35 sand mixes and gave a clear visual response of vertical growth as well (Photo 2). Applications of foliar fertilizers, ZeoPro, and gypsum generally did not increase establishment, but they did increase turf quality on some mixes and varieties at several rating dates (Figure 2). The RyzUp treatment required more frequent mowing than any of the other treatments, hence some scalping and reduced turf quality occurred in this treatment due to our mowing not often enough.
Two disease outbreaks occurred during the first six months of growth, Bermudagrass Leaf Blotch (Bipolaris cynodontis) and Dollar Spot (Sclerotinia homeocarpa). Disease was almost exclusively confined to the #35 sand 95:5 mix and more prevalent in TifEagle than MiniVerde (Figure 3).
Summary
Characteristics of the soil mix had a profound effect on grow-in of MiniVerde and TifEagle bermudagrasses. The higher the water and nutrient holding capacity the faster the growin. Turf quality of the turf was better as well. Bermudagrass Leaf Blotch and Dollar Spot were also less prevalent on the mixes with greater water and nutrient holding capacity. The improvement in turfgrass vigor on these mixes likely enhanced their ability to ward off the disease organisms.
This research is, of course, only in its infancy. Many questions remain. Will the profound differences due to soil mix properties already witnessed diminish as the green ages and rootzone organic matter increases due to root turnover? Possibly. Or, will improvement in water and nutrient holding capacity in the #35 sand 95:5 mix be slow, resulting in increased disease and poorer turf quality for years to come? Can more, or more frequent, water and fertilizer be applied to achieve the same level of quality? How much more? What about thatch accumulation and management? Will this important aspect of ultradwarf management be easier or more difficult with increases in soil mix water and nutrient holding capacity? We will keep you posted.
We thank:
Carolinas Golf Association for funding this research
NewLife Turf for the gift of TifEagle sprigs.
Modern Turf for the gift of MiniVerde sprigs.
GRIGG™ for the gift of liquid fertilizers.
Rogers’ Laser Grading for financial assistance with laser grading.
Golf Agronomics for financial assistance with the soil mixes.
Table 1. Physical properties of sand mixtures used for the ultradwarf bermuda green at the Pee Dee Research and Education Center. Mixes used were: 1) a 35 sand in a sand to peat ratio of 95:05 (v:v), 2) a #35 sand in a sand to peat ratio of 85:15 (v:v), and 3) a #65 sand in a sand to peat ratio of 85:15 (v:v).